Optimizing Ling-2.6-1T on TPU with SGLang-JAX: Hiding MoE Data Movement Behind Compute with One Pallas Kernel
SGLang-JAX now supports efficient serving of inclusionAI's Ling-2.6-1T on TPU v7x. With a working baseline in place, profiling pointed to the Mixture-of-Experts (MoE) path as the main bottleneck: each layer scatters tokens across 32 JAX devices (two per v7x chip), runs the expert FFNs, and gathers the outputs back. This post focuses first on Fused MoE V2, a new Pallas kernel that fuses scatter, expert FFN, and gather while overlapping TPU compute and data movement.
With Fused MoE V2, MoE prefill latency drops from 5.16 ms to 2.42 ms, and on the same SGLang decode benchmark, 16 TPU v7x chips reach 1.29×–1.77× the output throughput of 16 H200 GPUs. The full numbers are below.
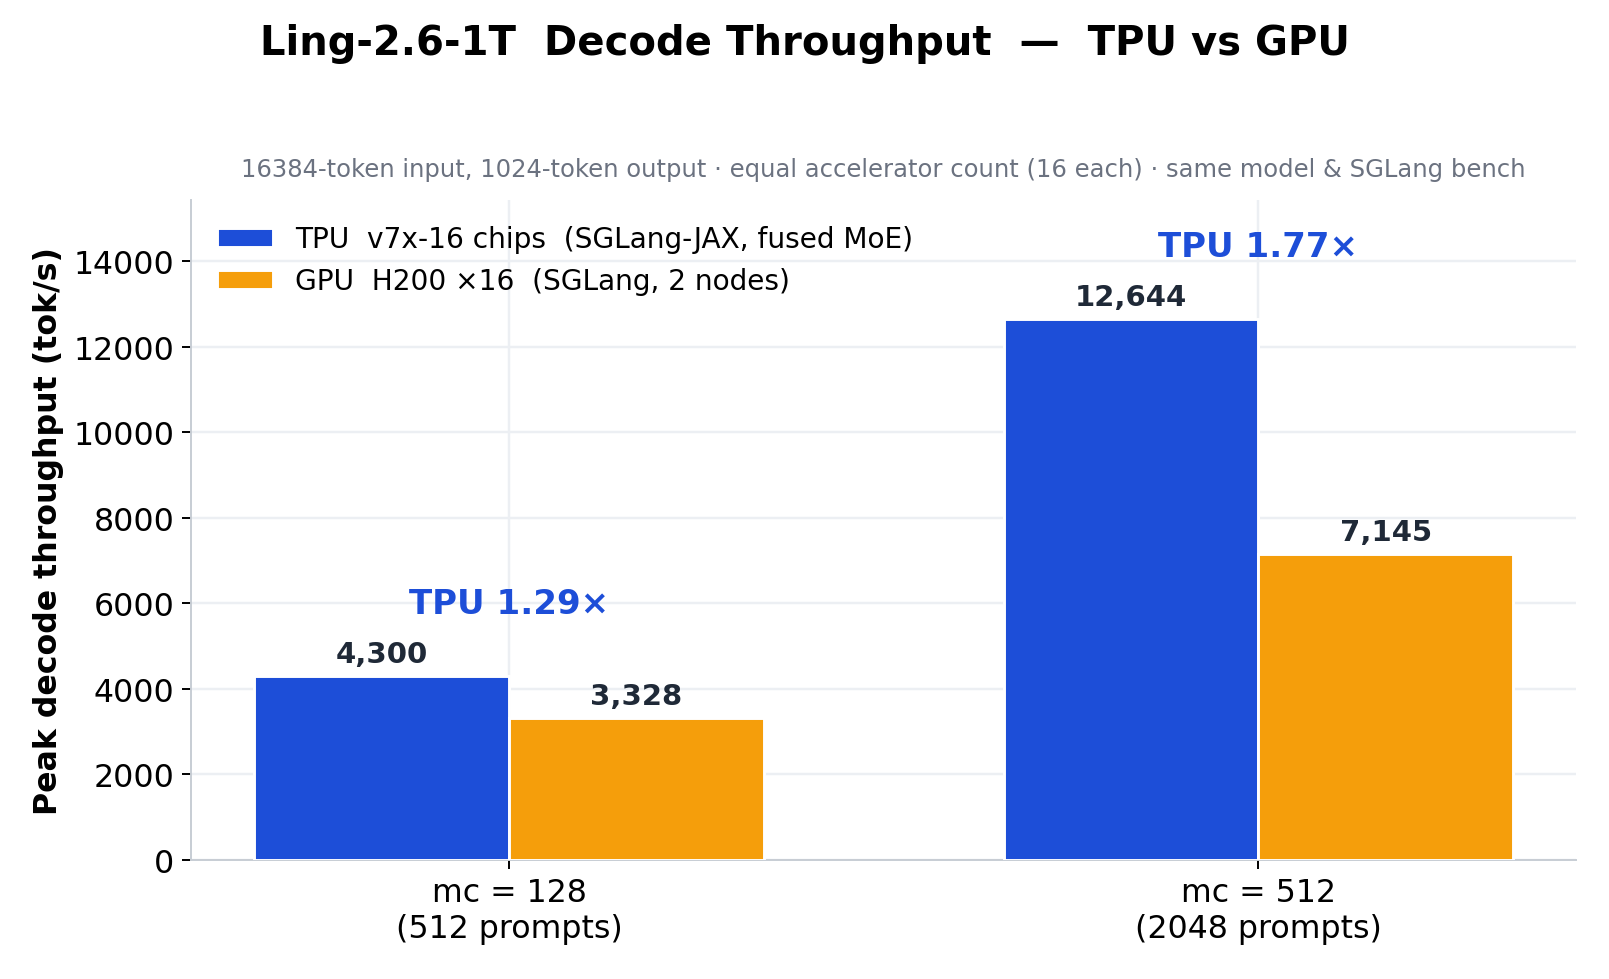
Figure 1. Ling-2.6-1T decode throughput on TPU v7x-16 vs H200×16, using SGLang's default `random` benchmark dataset (sampled from ShareGPT) with 16,384-token input and 1,024-token output.
TL;DR
- Fused MoE V2: MoE prefill latency drops by 53% vs Fused MoE V1 (5.16 → 2.42 ms); decode kernel latency drops by about 15% (0.249 → 0.211 ms).
- End-to-end gains: Replacing only the MoE kernel improves prefill throughput by 24.8% and decode throughput by 18.5%–35.3%.
- TPU vs H200 decode: TPU v7x-16 delivers 1.29× the decode output throughput of H200×16 at
mc=128, and 1.77× atmc=512. - Beyond MoE: The full Ling-2.6-1T bring-up also includes hybrid KV/recurrent memory pools, GLA linear attention, and single-controller data parallelism.
Ling-2.6-1T at a glance: a 1T sparse MoE model with 63B activated parameters per token, 256 routed experts with top-8 routing plus one shared expert, per-channel fp8 MoE weights, and a hybrid MLA + Lightning Linear backbone. The MoE structure drives the kernel work in the first half of this post; the hybrid backbone motivates the later memory-pool and GLA bring-up sections.
The Setup: Optimizing the Fused MoE Kernel
All MoE numbers in this section come from jax.profiler device traces unless noted otherwise. The setup is a 16-chip TPU v7x slice: ep=32, a 2×2×4 ICI torus, and two devices per chip. The workload is Ling-2.6-1T with 16,384-token prefill and a 512-token decode batch, using per-channel fp8 MoE weights. All lower bounds in this section are computed per device, roughly half of the chip-level compute and bandwidth; see the appendix for the chip specs.
Fused MoE V2 gets there by changing how routed tokens, expert weights, and accumulators move through VMEM, HBM, and ICI.
1. MoE kernel cost model
Ling-2.6-1T has 256 routed experts and one shared expert per layer, with top-8 routing. With ep=32, each device owns 8 local routed experts. The 8 experts selected by a token are usually spread across devices, so the routed path in every layer has the same shape:
scatter tokens -> local expert FFN -> gather results
With this structure, MoE's operational cost is more than GEMM FLOPs. The kernel has to move data through three expensive paths: token routing across chips, expert weight reads from HBM into VMEM, and fp8 layout / scale handling around the matrix multiply unit (MXU).
The shared expert is a local dense path. It increases local FFN compute, but it does not participate in the routed all-to-all and has little impact on the token-routing payload.
Compute lower bound
At prefill 16,384, top-8 routing, and ep=32, each device processes:
16384 * 8 / 32 = 4096 routed rows / device
On average, each of the 8 local routed experts sees about 512 rows. The shared expert does not fan out through top-k routing; it runs once on the local 4096 rows. The routed + shared FFN compute is:
FFN1: 8 experts * 2 matrices * (2 * 512 * 8192 * 2048) = 274.9 GFLOP
FFN2: 8 experts * 1 matrix  * (2 * 512 * 2048 * 8192) = 137.4 GFLOP
Routed total: 412.3 GFLOP / device
Shared expert: 3 matrices * (2 * 4096 * 8192 * 2048) = 412.3 GFLOP
Total: 824.6 GFLOP / device
TPU v7x public specs list about 4.614 PFLOP/s fp8 compute per chip. In this deployment, each chip is exposed as two devices, so the rough per-device fp8 peak is 2.307 PFLOP/s. The ideal compute lower bound is:
824.6 GFLOP / 2307 TFLOP/s = 0.36 ms
This is an ideal lower bound that excludes data movement, fp8 packing/unpacking, and scale handling on the vector processing unit (VPU). The measured 2.42 ms production trace is still about 7× above this bound, so pure GEMM FLOPs do not explain the latency.
ICI token routing lower bound
Each device's scatter payload is:
4096 rows * 8192 hidden = 33,554,432 elements
bf16: 67.1 MB
fp8 : 33.5 MB
TPU v7x has 1.2 TB/s of bidirectional ICI bandwidth per chip, which works out to roughly 100 GB/s per direction on each link. The 2×2×4 torus gives each chip 4 effective links, so the effective one-way chip bandwidth is roughly 4 × 100 GB/s = 400 GB/s. Since two devices share one chip, a rough per-device one-way injection bandwidth is about 200 GB/s.
Looking only at injection bandwidth, ignoring hops and contention, the lower bound is:
| payload | one scatter | scatter + gather |
|---|---|---|
| fp8 33.5 MB | 0.17 ms | 0.34 ms |
| bf16 67.1 MB | 0.34 ms | 0.67 ms |
But all-to-all is not a single-link bandwidth test. On a 2×2×4 torus, the average random destination is about two hops away: roughly 0.5 hop on x, 0.5 on y, and 1.0 on z. With this hop factor, the topology-adjusted lower bound is closer to:
| payload | one scatter, avg-hop adjusted | scatter + gather |
|---|---|---|
| fp8 | 0.34 ms | 0.67 ms |
| bf16 | 0.67 ms | 1.34 ms |
This still excludes link contention, small DMA granularity, runtime overhead, and fp8 layout handling. Even so, token routing is already in the same range as the routed + shared ideal compute lower bound, and well above the routed-only compute lower bound.
HBM weight movement lower bound
Now consider the HBM read cost for routed expert weights. If weight prefetch is not hidden by the pipeline, this cost immediately becomes visible.
The fp8 weights for one local expert are:
W1 + W3 + W2 = 3 * 8192 * 2048 bytes = 50.3 MB
8 local experts = 402 MB
The shared expert adds another local FFN weight set, roughly the size of one local expert, but it does not introduce all-to-all traffic. The estimate below focuses on the routed expert path.
TPU v7x HBM bandwidth is about 7.38 TB/s per chip, or roughly 3.69 TB/s per device. Reading all 8 local experts once has a lower bound of:
402 MB / 3.69 TB/s = 0.11 ms
In practice, the kernel re-reads weights once per token-staging tile. The tile size is set by bts, the block token staging size: the number of routed token rows brought into VMEM for one expert FFN tile. Ling prefill uses bts=160. Since each expert sees about 512 rows, prefill needs ceil(512 / 160) = 4 token staging tiles. V2 pipelines weight prefetch across those tiles, so the HBM read lower bound is roughly:
4 * 402 MB / 3.69 TB/s = 0.44 ms
Weight reads do not have to appear on the critical path. V2 hides them behind the MXU window with double buffering. These numbers explain why that scheduling is required: if HBM reads are serialized before GEMMs, they already exceed the pure compute lower bound.
Takeaway
MoE on TPU is mainly a data movement and overlap problem:
- routed + shared FFN compute lower bound: about 0.36 ms;
- fp8 scatter + gather topology lower bound: about 0.67 ms;
- expert weight HBM read lower bound: about 0.11 ms per tile, or about 0.44 ms with
bts=160; - fp8 packing, scale broadcast, and layout reorder still consume VPU and VMEM bandwidth.
The optimization target is not to reduce FFN FLOPs. It is to hide token routing, weight prefetch, and fp8 reorder behind the routed compute window.
2. Why this needs a Pallas fused kernel
The rest of this section uses some TPU terminology. The simplified picture is: a TensorCore contains MXU, VPU, and VMEM; HBM sits outside the chip; chips communicate over ICI.
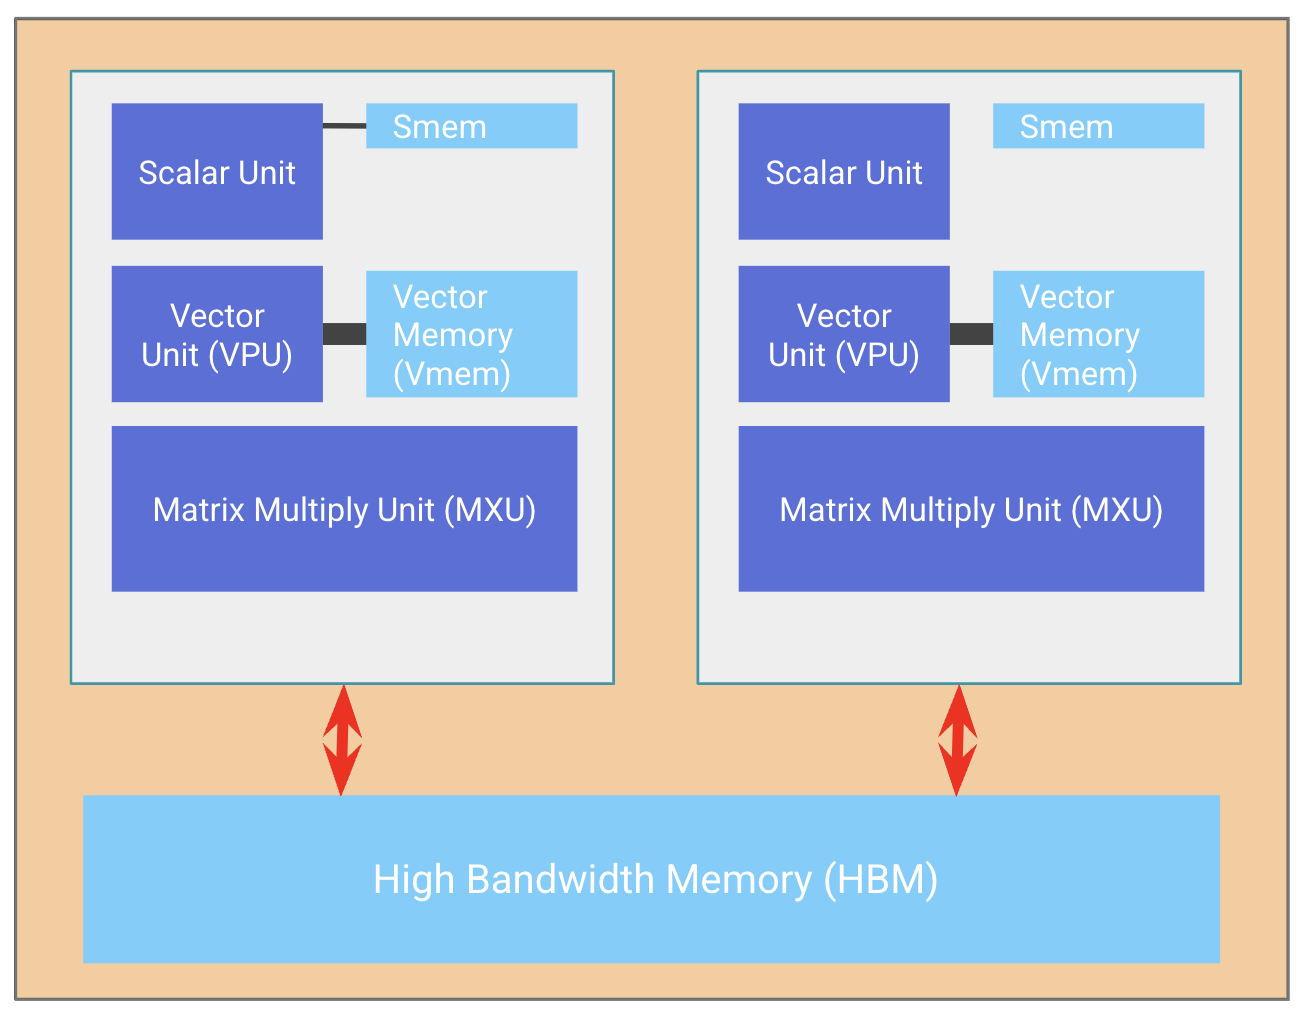
Figure 2. Simplified TPU execution model used in this section, adapted from the JAX Scaling Book TPU overview.
In the MoE kernel, these units map to the following work:
| Hardware unit | TPU role | Work in MoE |
|---|---|---|
| MXU | matrix multiply unit | W1/W3 gate-up GEMM and W2 down GEMM for routed experts |
| VPU | vector math, reductions, layout work | SiLU, gating multiply, scale multiply, fp8 pack/unpack, lane reorder |
| VMEM | on-chip scratchpad close to MXU/VPU | routed token tiles, expert intermediates, output accumulators, prefetched weight tiles |
| HBM | large off-chip memory attached to each chip | expert weights, token staging buffers, large intermediate buffers |
| HBM-DMA | HBM ↔ VMEM movement | prefetch current / next expert weights into VMEM; move staging buffers when needed |
| ICI / ICI-DMA | direct inter-chip network inside a TPU slice | move routed token payloads between source and target chips; scatter to expert owners and gather outputs back to token order |
A pure-JAX native MoE can express routing, expert FFN, and output aggregation correctly. What it cannot expose is the fine-grained schedule inside a single MoE layer. Once scatter, expert FFN, HBM weight movement, fp8 layout work, and gather cross multiple JAX op or collective boundaries, XLA cannot reliably place ICI-DMA, HBM-DMA, MXU, and VPU work onto one hand-scheduled pipeline.
This path also cannot be treated as an independent sparse lookup and offloaded to the SparseCore: the local expert token layout produced by scatter, per-expert offsets, expert outputs, and final token order all depend on each other. The useful optimization surface is inside the MoE kernel itself.
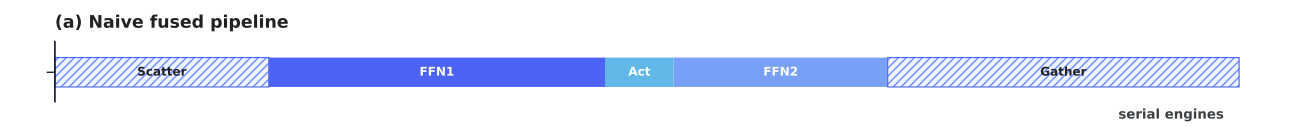
Figure 3. Naive fused pipeline with serial communication and compute phases. The semantics are correct, but the engines are not scheduled with fine-grained overlap.
The ideal steady state is: while the MXU computes expert i, HBM-DMA prefetches expert i+1's weights, ICI-out sends the next batch of routed tokens, ICI-in receives the previous batch of outputs, and the VPU handles scale and layout work from the prior matmul.
To express that schedule, scatter, expert FFN, and gather need to live inside one Pallas kernel. Fusion is not primarily about reducing op count; it creates a scheduling space where dependent stages can be manually arranged across MXU, VPU, HBM-DMA, and ICI-DMA.
3. V1: fused, but with fragmented hidden tiling
Our starting point is Fused MoE V1, originally proposed and optimized by Jevin Jiang, Kyuyeun Kim, and others in the tpu-inference project [4], and adapted into SGLang-JAX as FusedEPMoE with some modifications [5]. V1 already places scatter, expert FFN, and gather in one Pallas call, and executes the 8 local experts on each device. This satisfies the precondition for in-kernel communication/compute scheduling, but V1 still does not reach the ideal steady state above.
The issue is inside the expert. An MoE expert needs more than the input token tile and one GEMM output. To overlap communication and compute, the kernel also needs weight staging buffers, intermediate activations, output accumulators, and DMA double buffers. With Ling's hidden size of 8192, keeping the full hidden dimension resident quickly exhausts VMEM, especially for f32 accumulators and W1/W3/W2 staging.
V1 therefore takes the conservative path: slice the hidden dimension and stream smaller working sets through VMEM.
For Ling 16,384 prefill, the V1 config is:
bf=1024 / bd1=512 / bd2=512 / bts=128 / btc=128
This block config answers a placement question: which token rows, intermediate channels, and hidden channels stay in VMEM, and which ones stream in from HBM.
The parameters can be read as tile sizes along the GEMM axes:
| Param | Controls | Performance meaning |
|---|---|---|
bts | routed token rows staged into VMEM for one expert tile | controls M; if too small, DMA / VPU / MXU fixed costs are not amortized |
btc | token rows inside bts fed to one compute loop | inner M compute tile; must not exceed bts, usually divides it |
bf | intermediate channels of W1/W3/W2 | controls the FFN intermediate tile; larger usually gives a longer MXU window but costs more VMEM |
bd1 | FFN1 hidden reduction-K slice | V1 slices hidden K; smaller bd1 means more, smaller FFN1 dots |
bd2 | FFN2 hidden output-N slice | V1 slices output hidden; smaller bd2 makes partial outputs round-trip through HBM more often |
So bf/bd1/bd2 mainly control the feature / hidden dimensions, while bts/btc control token rows per expert. Together, they decide whether a tile fits in the 64 MB VMEM budget and how much HBM-DMA / VPU work can be overlapped around the MXU.
V1 pays three structural costs:
| Cost | V1 behavior | Why it hurts |
|---|---|---|
| FFN1 dot is too small | bd1=512; after fp8 packing, effective K is about 256, so V1 scans 16 hidden-dimension slices | vmatmul fixed overhead is poorly amortized |
| token staging is too frequent | num_bf * num_bd1 * num_token_tiles = 2 * 16 * 4 = 128 HBM→VMEM stagings | many small DMAs and layout steps |
| FFN2 partials spill to HBM | partial output is written to a2a_s_acc_x2_hbm, then read back for later bf accumulation | HBM read-modify-write fragments the critical path |
V1 has some micro-overlap, but hidden-dimension slices make the overlap window small. Prefetch only covers one small slice at a time, and FFN2 partial outputs still round-trip through HBM. V1 prefill latency is 5.16 ms.
4. V2: VMEM residency and weight double buffering
V2 is not just a larger V1 tile. It changes tensor lifetimes. V1's loop cycles through hidden-dimension slices; V2 keeps routed tokens, gate/up intermediates, and the output accumulator resident in VMEM across the FFN loop, while W1/W3/W2 stream from HBM through double buffers.
This spends more VMEM on long-lived tensors, but it removes most hidden-slice staging and almost eliminates the FFN2 HBM read-modify-write path.
The Ling 16,384 prefill V2 production config is:
bf=512 / bts=160 / btc=80
V2 has no bd1 or bd2, because it no longer slices the hidden dimension. The structural change is:
| Per expert | V1 | V2 | Effect |
|---|---|---|---|
| FFN1 dot | effective K about 256 per hardware dot | fp8 chunk K about 2048; 4 chunks cover full hidden | K about 8× larger |
| W2 output | bd2=512, producing a narrow hidden slice each time | output chunk about 4096 hidden channels | N about 16× larger |
| token staging | 128 small stagings | about 4 full-hidden stagings | about 32× fewer stagings |
| FFN2 accumulator | partial output spills / reloads through HBM | b_y_acc_vmem accumulates across bf inside VMEM | HBM read-modify-write mostly disappears |
This also explains why simply increasing bd1 / bd2 in V1 is not enough. In V1, larger hidden tiles also enlarge weight buffers, token staging buffers, and partial-output staging, quickly hitting the 64 MB VMEM ceiling. More importantly, V1 still cycles through hidden slices; it does not make tokens and the output accumulator resident.
With this VMEM-resident working set, V2 gets larger MXU tiles, fewer HBM spills, and a longer routed compute window. Before activation quantization, V2 already cuts prefill latency from 5.16 ms to 3.02 ms in device traces. After enabling activation quantization and in-kernel shared expert overlap, the production trace reaches 2.42 ms, about 53% below V1.
Decode follows the same logic, but has less headroom. With a 512-token decode batch, kernel latency drops from 0.249 ms to 0.211 ms, about 15%. Each expert's effective M dimension is small, so MXU tiles do not amortize fixed overhead as well; the path is also closer to the expert-weight HBM read lower bound, with decode traces already reaching about 80% HBM bandwidth utilization. So V2 still helps decode, but it does not realize the full VMEM-residency and routed-window gains the way prefill does.
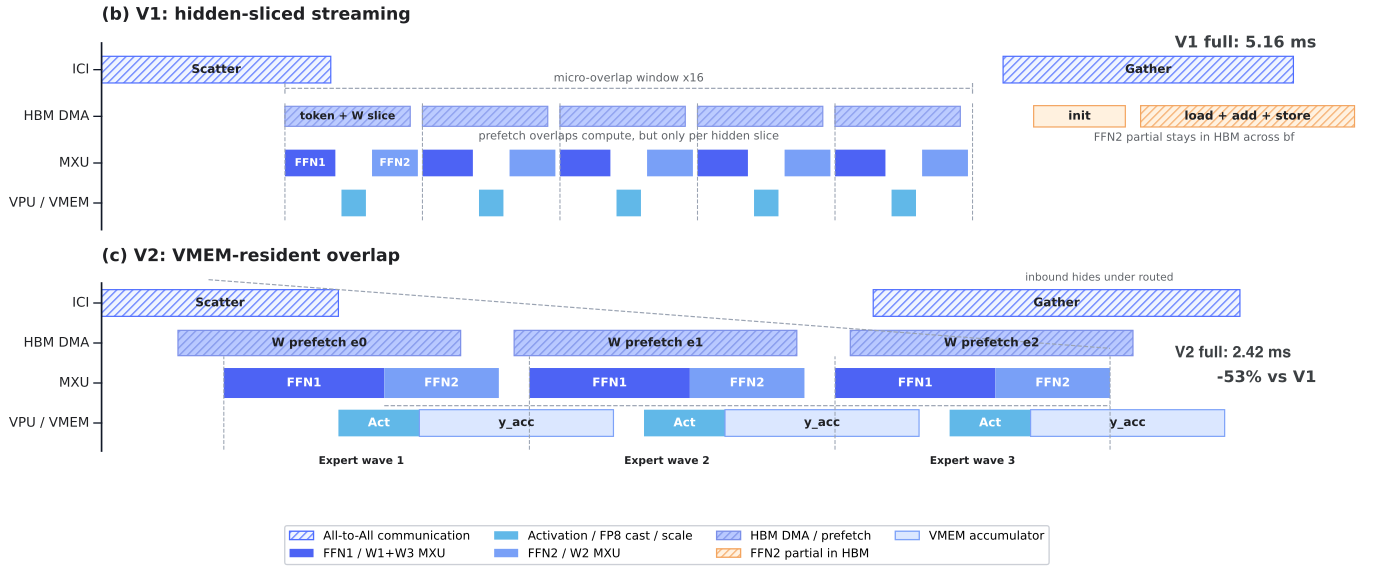
Figure 4. Conceptual timeline for V1 and V2 fused MoE. V1 creates only small overlap windows because hidden-dimension slices cycle frequently; V2 keeps tokens and accumulators resident in VMEM, double-buffers expert weights, and hides most scatter/gather traffic behind the routed compute window.
5. Targeted V2 optimizations
Per-channel direct_scaled_dot
The scale granularity of fp8 weight quantization determines whether the MXU sees one large GEMM or a sequence of small ones.
With per-block quantization, the scale depends on the K block:
out[m,n] = sum_k A[m,k] * W[k,n] * scale[block(k),n]
The scale cannot be pulled out of the reduction, so K must be split into blocks. Each block does a small fp8 dot, multiplies by that block's scale, and accumulates. A large GEMM becomes many smaller GEMMs with VPU work inserted between them.
With per-channel quantization, the scale depends only on the output channel:
out[m,n] = (sum_k A[m,k] * W[k,n]) * scale[n]
The scale can be applied after the reduction. V2's direct_scaled_dot sends fp8 tokens and fp8 weights directly into the MXU, gets f32 partials, and only then applies per-token / per-channel scale. Ling's MoE weights use per-channel scales, so this path is available.
This preserves the full K dot and avoids slicing a large GEMM into scale blocks. The remaining cost is fp8 sub-word packing, scale broadcast, and lane reorder. Per-block quantization would add K segmentation and inter-block scale handling on top.
Activation quantization
V2 quantizes activations from bf16 to fp8 before scatter, directly halving the routed token payload. On Ling 16,384 prefill, the in-kernel scatter stage falls from 1.39 ms to 0.65 ms.
This matches the ICI lower-bound math above: when the payload drops from bf16 67 MB to fp8 33.5 MB, the communication lower bound nearly halves.
Ling-2.6-1T supports activation quantization, so V2 uses dynamic per-token fp8, with no accuracy regression observed in our evaluations (see the AIME 2026 check in the appendix).
In-kernel shared expert
Ling also has one shared expert per layer. If it runs as a separate dense MLP, it adds its own critical-path segment. V2 moves the shared expert into the same kernel, reuses the routed experts' token / weight VMEM buffers, and schedules it inside the scatter window.
The shared expert's own compute is about 0.159 ms, but it adds only 0.068 ms to the critical path, about 2.7%. The reason is simple: the shared expert does not need cross-chip token dispatch; all required tokens are local, so it can overlap with the scatter phase that precedes the routed FFN.
6. Where the gain comes from
The breakdown below shows the critical path for prefill 16,384 with activation quantization and in-kernel shared expert enabled. Hatched regions are real work hidden under other stages.
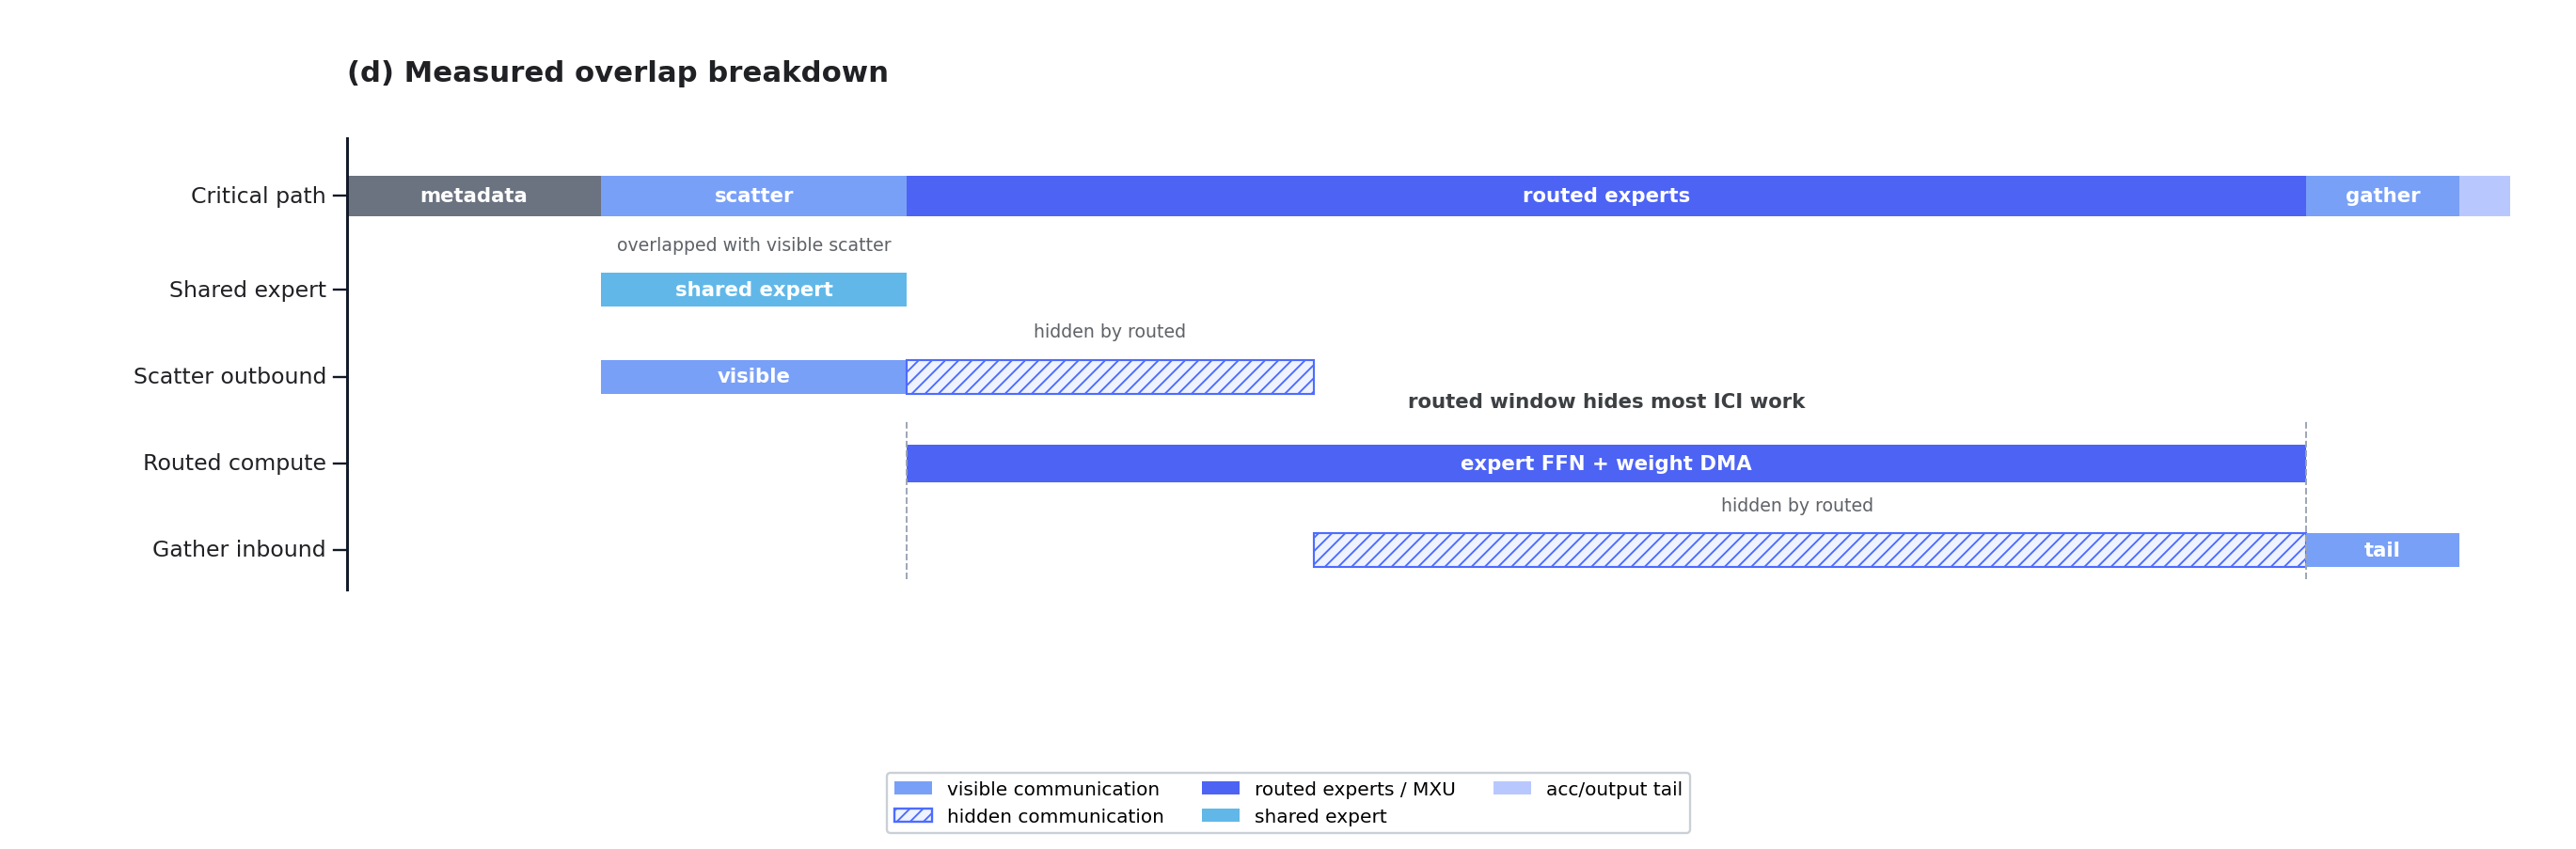
Figure 5. Measured overlap structure for Fused MoE V2. Most scatter/gather traffic is hidden under the routed expert window; only the scatter lead and gather tail remain visible.
The metadata block is routing bookkeeping: token-to-expert/device mapping, per-expert offsets/counts, and scatter/gather indices. It moves only small metadata, takes tens of microseconds, and is not a core prefill cost.
Ablating the same V2 kernel shows what remains exposed on the critical path:
| Ablation / component | Result | Interpretation |
|---|---|---|
| full V2 production | 2.42 ms | canonical MoE prefill latency used in this section |
| disable all expert matmuls | -2.2% vs full | pure MXU compute is not exposed |
| visible scatter | 0.42 ms | communication lead remains on the critical path |
| visible gather | 0.18 ms | gather tail remains on the critical path |
| scatter + gather without compute to hide under | ~2.4 ms | real communication is close to full kernel latency before overlap |
This matches the cost-model analysis. Even including the shared expert, the ideal compute lower bound is only about 0.36 ms, and removing matmuls barely changes total latency. The scatter/gather work is close to 2.4 ms, but about 1.8 ms is hidden underneath the routed compute window.
V2 therefore gets its gain from three mechanisms:
- tokens and accumulators stay resident in VMEM, reducing token staging and HBM read-modify-write;
- expert weights are double-buffered so HBM reads hide behind MXU work;
- scatter/gather use banked buffers and outbound/inbound ICI channels to overlap with routed compute.
7. What remains after V2
After overlap, the longest segment remaining in Figure 5 is the routed compute window, about 68% of the 2.42 ms total. This does not mean the problem has returned to pure FLOPs: the Mosaic LLO dump shows that the remaining bottleneck is mostly fp8 packing / lane reorder / scale broadcast, plus VMEM limits on tile size.
Communication is topology-limited
In our measurements, flat all-to-all beats hierarchical all-to-all. In the flat config, the send/recv partition is built directly from the final expert owner, and one 32-way all-to-all sends the routed token payload from the source device to the final target device.
We also measured a hierarchical config: splitting the 32-device exchange along the 2×2×4 ICI torus, first reshuffling within a local dimension, then relaying along the next dimension until each token reaches the target expert's device. Each round communicates over a smaller scope, but the same routed token payload crosses multiple relay stages, adding staging buffers, synchronization boundaries, and nearly doubling total bytes moved. Both modes are measured as a standalone all-to-all benchmark outside the fused kernel, so the numbers are not directly comparable to the in-kernel traces.
| Mode (payload = 16384 × 8192 × dtype_size) | bf16 | fp8 |
|---|---|---|
| flat all-to-all | 2.09 ms | 1.34 ms |
| hierarchical all-to-all | 3.12 ms | 1.88 ms |
The practical lever on the communication side is therefore not a more complex routing algorithm, but fewer bytes and better overlap. Activation quantization is exactly that.
Routed compute is VPU / VMEM-limited
Routed FFN1 (W1+W3) measures about 0.72 ms, while an ideal dense fp8 GEMM lower bound is about 0.12 ms. The gap is not caused by activation quantization: FFN1 is about 0.74 ms with act quant on and 0.71 ms with it off.
A tile sweep also shows the current config is near a local optimum:
bts / btc | kernel latency | VMEM |
|---|---|---|
| 160 / 80 | 2.42 ms | 47 MB |
| 160 / 160 | 2.44 ms | 47 MB |
| 128 / 128 | 3.12 ms | 44 MB |
| 256 / 128 | 3.19 ms | 54 MB |
| 256 / 256 | 3.23 ms | 54 MB |
| 384 / 128 | OOM | 62 MB |
The Mosaic LLO dump explains why. The whole kernel has only 4096 real vmatmul instructions, while fp8 layout and vector-side preparation dominate the instruction stream:
| LLO instruction | Count | Role |
|---|---|---|
vselect | 50880 | sublane select / blend |
vbitcast | 46566 | fp8 sub-word reinterpretation |
vcombine | 36380 | sublane merge |
vpack_format | 34368 | MXU input packing |
slane | 29960 | sublane movement |
vunpack | 25600 | fp8 unpack |
matmul_data_format | 25600 | format conversion before MXU |
vrot | 21524 | lane rotation |
vmatres / vmatprep | 17408 / 10240 | MXU drain / feed |
vslreplicate | 6032 | scale broadcast |
vmatmul | 4096 | actual matrix multiply |
V2 avoids the K-slicing of per-block quantization, but fp8 sub-word packing, scale broadcast, and MXU feed/drain still consume significant VPU / layout work. Because VMEM is capped at 64 MB, bts cannot keep growing; with small tiles, these fixed costs cannot be amortized away.
Summary
After V2 hides most explicit communication and HBM weight movement, the remaining bottleneck is still data movement, just in another form: fp8 layout work, VMEM capacity pressure, and keeping the MXU fed.
- ICI all-to-all is limited by torus topology and contention.
- HBM weight reads must be hidden with double buffering.
- fp8 packing and scale handling keep the MXU waiting for data to take shape.
- VMEM capacity limits tile size and the number of overlap buffers that can coexist.
The next step has to change the constraints themselves:
- Kernel side: reduce fp8 pack/unpack and scale handling, but this increasingly depends on aligning model quantization with TPU-native execution formats: TPU-friendly scale granularity, fp8 layout, or future MXU-native low-precision formats such as FP4 or MXFP8.
- Workload side: overlap across batches so the routed window can run alongside other layer work.
- Hardware side: provide interconnect topologies that better support all-to-all, or provide larger VMEM / higher ICI bandwidth.
For future TPU hardware, see Google Cloud's TPU 8t and TPU 8i technical deep dive.
Ling-2.6-1T Bring-up
MoE fusion is only one part of making Ling-2.6-1T serve well on TPU. The rest of the bring-up was about matching the runtime to the model's hybrid backbone: allocating state differently for full-attention and linear-attention layers, running GLA prefill and decode through TPU-friendly kernels, and mapping DP/TP so grouped RMSNorm stays chip-local.
Hybrid Memory Pools
Ling-2.6-1T does not expose a single uniform attention state to the runtime. Its 10 MLA full-attention layers write token-indexed KV cache, while its 70 Lightning / GLA layers carry request-indexed recurrent state. The allocator therefore has to manage two different capacities at once: resident history tokens for MLA, and active request slots for the linear-attention layers.
The unit comparison is easy to misread. At TP=4, with bf16 KV and fp32 recurrent state, the MLA KV cache costs about 12.5 KiB per device per token across the 10 full-attention layers. The Lightning recurrent state costs about 70 MiB per device per request across the 70 linear layers. Those two numbers only become meaningful when placed back into a request: a 16K-token prompt needs roughly 200 MiB of MLA KV per request, and a 256K-token prompt needs roughly 3.1 GiB, while the recurrent state stays around 70 MiB. Recurrent state is a fixed concurrency cost; KV cache is a token-capacity cost that grows linearly with context length.
SGLang-JAX separates those state types while keeping one request lifecycle: HybridLinearKVPool holds KV only for the 10 full-attention layers (the 70 linear layers consume no KV slots), RecurrentStatePool holds one fp32 recurrent slot per active request, and HybridReqToTokenPool ties them together: a request acquires both at admission and releases both at finish. Chunked prefill and decode continue from the same recurrent slot instead of allocating new state per chunk or per token. The HBM budget is split the same way: a configurable fraction is reserved for recurrent slots, which caps concurrency, and the rest goes to KV cache, which caps resident tokens.
JAX adds one more constraint: the runtime cannot update these buffers in place the way a CUDA path would. SGLang-JAX wraps the KV pool and recurrent pool in a MemoryPools pytree and passes it into the model as a donated JIT argument. Each forward pass returns the updated pool buffers, and the runtime writes them back through replace_all(). This keeps buffer donation, TP/DP sharding, and future pool extensions at the container level rather than scattering special cases through the forward loop.
GLA (Gated Linear Attention)
Each GLA layer [7] keeps history in a fixed-size recurrent state instead of storing a KV entry for every past token. Its update can be written as:
This turns attention history from something that grows token by token into one state tensor per active request. At long context, that is the main benefit: carrying history stays linear in compute and fixed-size in state, instead of materializing and reading an ever-growing KV history.
Prefill: making the recurrence parallel enough for TPU. Read literally, the recurrence above is serial: token t depends on the decayed and updated state from token t−1. Running prefill this way would turn a 16K or 256K prompt into a long token-by-token scan, which is exactly the wrong shape for TPU.
SGLang-JAX uses the mathematically equivalent chunk-wise form. The sequence is split into fixed-size chunks of 64 tokens. Across chunks, the final state of one chunk becomes the initial state for the next, so the long-range dependency still moves forward in time. Inside a chunk, however, the recurrence is rearranged into dense matrix operations over the token block. Only the chunk boundary remains serial; the work inside each chunk runs as block-parallel TPU math.
Decode: the natural form of the recurrence. Decode is simpler: prefill has already folded the prompt into the recurrent state, so each new token reads the request's current state, applies one recurrent update, emits the attention output, and writes the new state back. The problem shifts from long-sequence parallelism to efficient small state updates.
Serving integration: keep GLA inside the same runtime path. GLA is integrated as a layer-level backend choice rather than a separate scheduler mode. Full-attention layers read and write KV cache; GLA layers read and write recurrent state; both advance through the same prefill and decode batches. The scheduler still sees one lifecycle: admit, prefill, decode, release.
That integration is functionally complete, but the prefill kernel has not yet been tuned to the same degree as Fused MoE V2. The GLA math does not need to change; the execution schedule does.
Single-Controller Data Parallelism Support
Ling-2.6-1T's grouped post-attention RMSNorm puts a hard constraint on tensor parallelism. Each norm group contains 8 heads. If a group spans chips, the variance computation becomes a cross-chip reduce on every layer, directly on the decode critical path. Pure TP therefore has no good setting: tp ≤ 8 keeps norm groups chip-local but under-parallelizes the trillion-parameter model, while tp > 8 splits norm groups and pays the all-reduce.
Single-controller DP resolves that tension by treating data parallelism as another mesh axis. The mesh is split into DP groups; each group uses TP small enough to keep grouped RMSNorm chip-local, and requests are partitioned across DP ranks. Weights remain TP-sharded within each DP group. The per-layer norm reduce disappears, and the freed ICI/HBM budget can go to higher concurrency instead.
The important design choice is that DP is part of the SPMD runtime, not a fleet of independent server replicas. SGLang-JAX runs one logical scheduler, and dp_rank is attached to requests, KV allocation, and prefix-cache keys. That gives global admission control from one load snapshot, deterministic batch construction across hosts, and one global prefix-cache structure with entries keyed by (dp_rank, prefix).
This also composes cleanly with the rest of the hybrid runtime. Scaling the mesh to larger configurations, such as adding tensor parallelism inside each data-parallel group, is a mesh-shape change rather than a scheduler fork, so the memory pools, batching path, and attention backends keep the same mental model.
Experiments and Benchmarks
All TPU results use SGLang-JAX serving Ling-2.6-1T on one TPU v7x slice; the setup is identical across the V1/V2 ablation; only the MoE kernel config differs.
Benchmark configuration
- Hardware: TPU v7x, 16 chips (2×2×4 ICI torus) → 32 devices
- Parallelism: tp = ep = 32, dp = 8
- Model: Ling-2.6-1T, bf16 activations, per-channel fp8 MoE weights
- Dataset: SGLang's default
randombenchmark dataset (sampled from ShareGPT) - Runtime: SGLang-JAX (JAX 0.8.1), dvfs p_state=7
- Input length: 16384
- Prefill: output 1, concurrency 128
- Decode: output 1024, concurrency 128 / 512
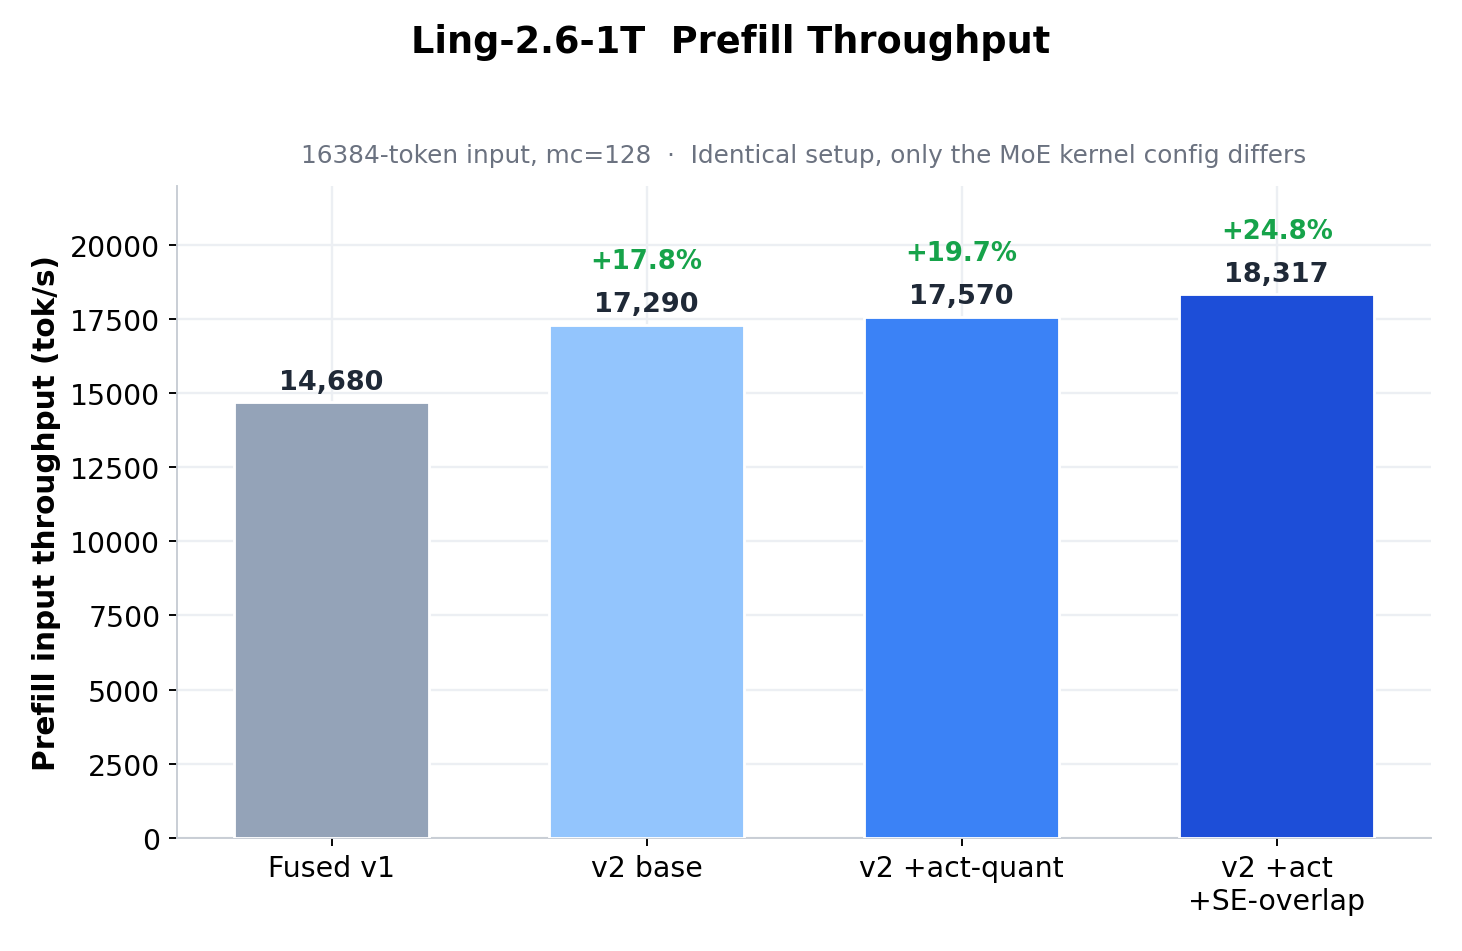
Prefill input throughput at 16384-token input, mc=128. Identical setup, only the MoE kernel config differs: Fused v1 → v2 base → v2 +act-quant → v2 +act +SE-overlap (+24.8%).
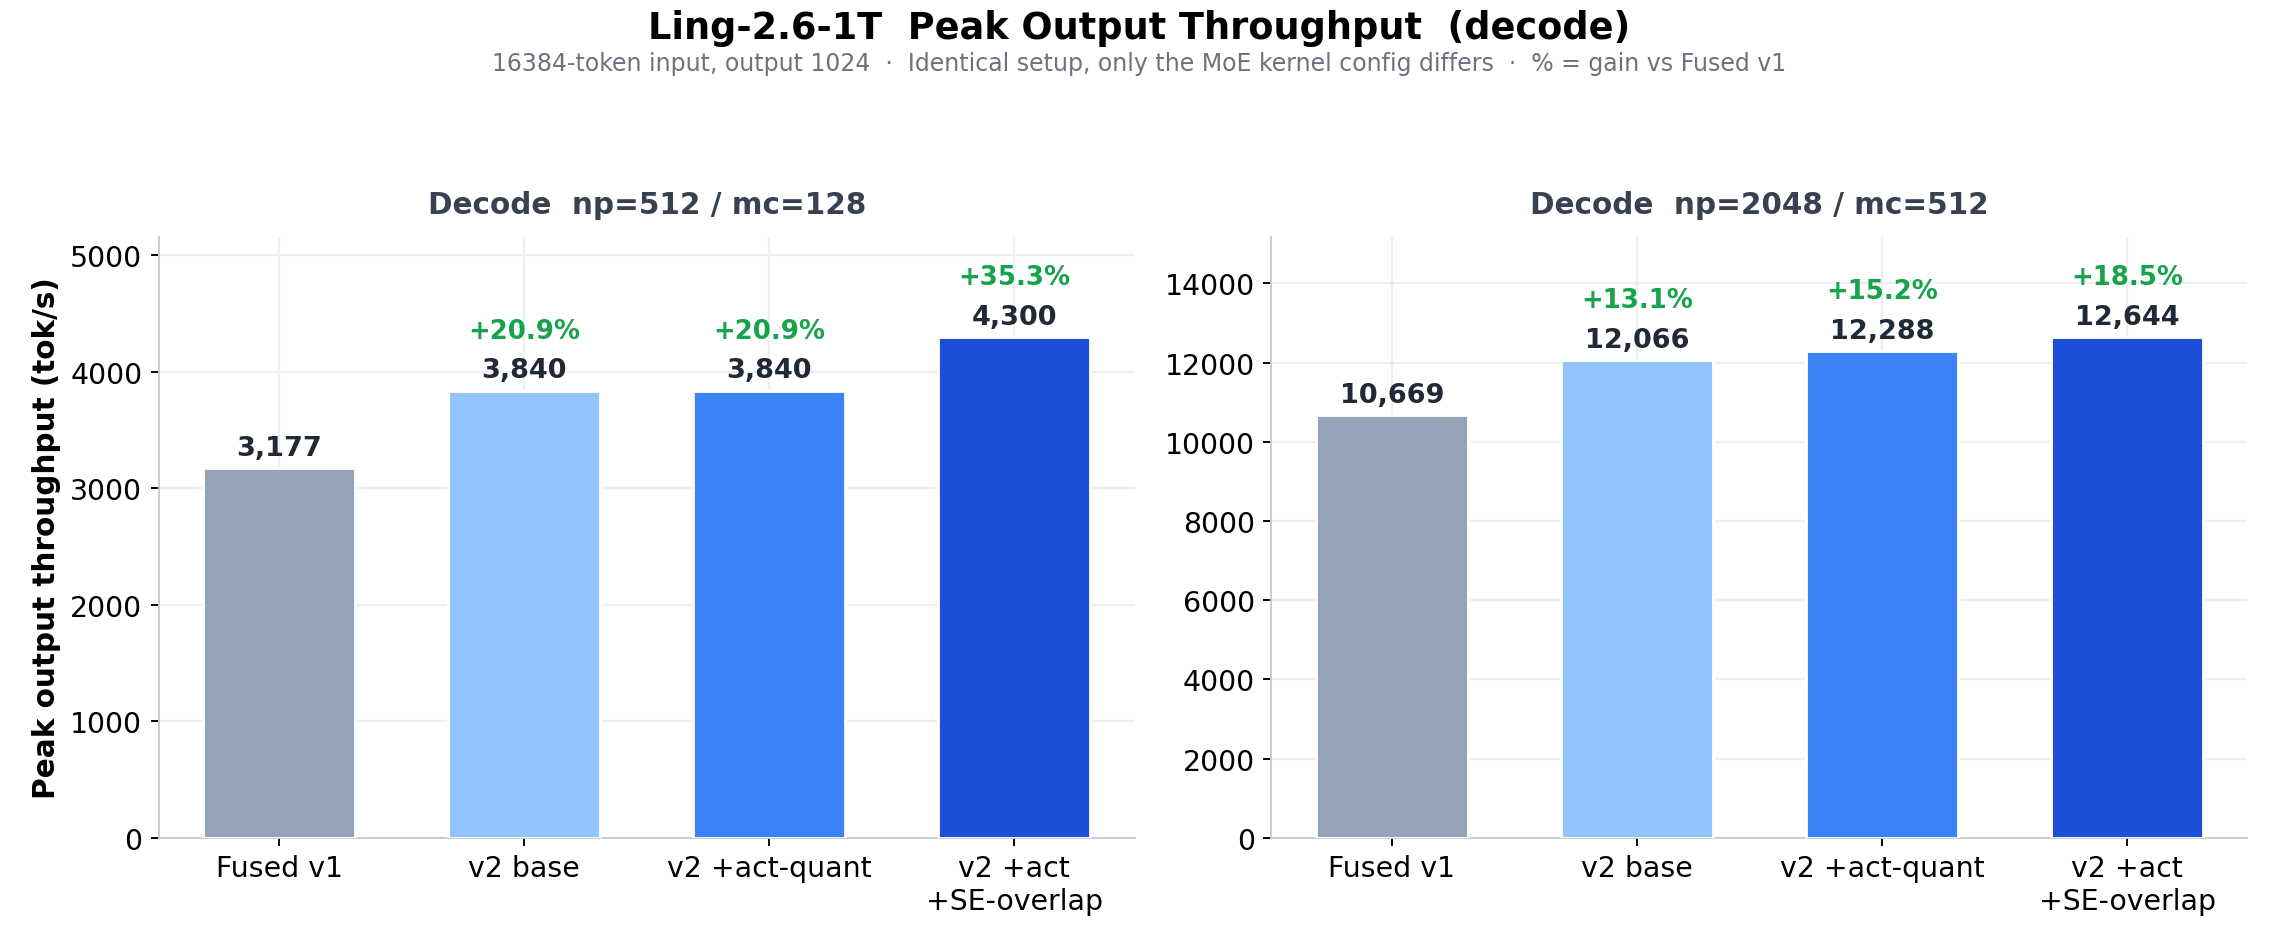
Peak output (decode) throughput at 16384-token input, output 1024, for np=512/mc=128 and np=2048/mc=512. % = gain vs Fused v1.
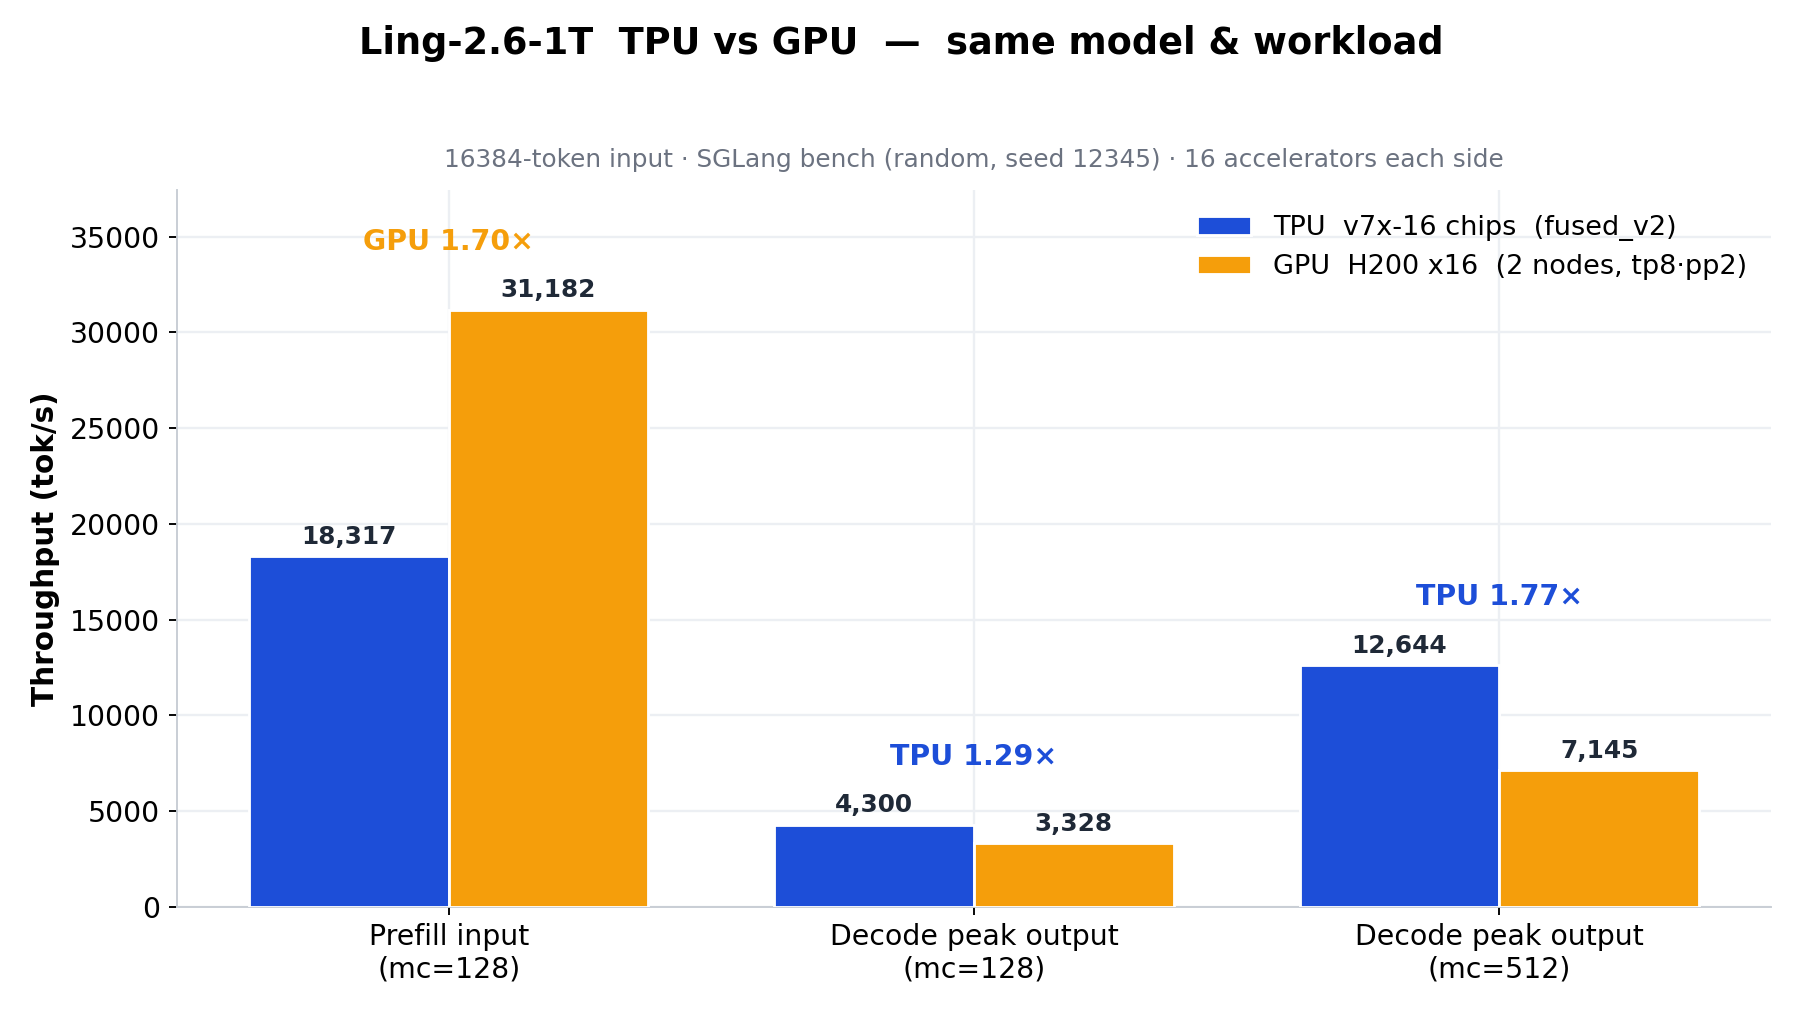
Figure 6. Full TPU-vs-GPU comparison: TPU v7x-16 (fused_v2) vs GPU H200×16 (2 nodes, tp8·pp2), same model and SGLang bench workload, 16 accelerators each side. See the note below on the prefill gap.
Note on end-to-end prefill vs MoE-kernel speedup: the Fused MoE V2 kernel cuts MoE-layer prefill latency by ~53% (device trace), but end-to-end prefill throughput improves by only ~25% (v1 → v2). The MoE layer is no longer the dominant prefill cost: the GLA (gated linear attention) prefill kernel is currently the main bottleneck and has not yet been optimized to the same degree, so it dilutes the end-to-end prefill speedup. The same bottleneck is why TPU v7x-16 trails H200×16 on the prefill column in Figure 6 while leading on both decode points. Bringing the GLA prefill kernel up to par is ongoing work, which we expect to unlock a larger end-to-end prefill gain.
Limitations and Future Work
Our Ling-2.6-1T support is intentionally scoped for this release; several items remain as follow-ups we're actively working on:
- GLA / Linear-Attention prefill kernel. As flagged in the benchmark section, the GLA (Lightning Linear) prefill kernel is now the dominant prefill cost. Bringing it up to par by considering methods such as better chunking/tiling, fusing the gating and recurrent-state updates, and applying the same MXU/VPU/DMA-overlap treatment used for the MoE kernel is the most direct remaining lever for end-to-end prefill.
- Dynamic Expert-Parallel Load Balancing (EPLB). The current
FusedEPMoEpath uses static expert-to-device placement, but real workloads have non-uniform hit rates across the 256 routed experts. A dynamic EPLB pass that periodically rebalances the expert-to-rank mapping from observed traffic would close the gap between peak and average per-device utilization, especially at higher batch sizes. - Radix cache over the hybrid memory pools. SGLang's RadixAttention [9] prefix cache assumes a single per-token KV pool, while Ling-2.6-1T mixes per-token KV with per-request recurrent state, so a naive prefix-share would silently mix state across requests on the linear layers. We're designing an extension that shares MLA KV by token prefix while snapshotting and re-keying the recurrent state per shared prefix, so shared system prompts and long agent traces can be reused without correctness loss.
- MTP / EAGLE speculative decoding. The Ling-2.6-1T checkpoint ships an EAGLE-style MTP head (3 speculative steps, 4 draft tokens, top-k 1). Our current path runs base-model decode only; integrating the MTP head with SGLang-JAX's speculative-decoding runtime is the next milestone for decode throughput. The hybrid memory-pool layer already accounts for the draft-step state, so the remaining work is on the verifier and draft-acceptance kernels.
Appendix
TPU v7x Specs Used in the Cost Model
TPU v7x public specifications list about 4.614 PFLOP/s of fp8 compute, 7.38 TB/s of HBM bandwidth, and 1.2 TB/s of bidirectional ICI bandwidth per chip. In this deployment, each chip is exposed as two devices, so the per-device lower bounds in the cost-model section use roughly half of the chip-level compute and bandwidth. For background on the TPU memory hierarchy and execution units (MXU, VPU, VMEM, HBM, ICI), see Google Cloud's TPU system architecture.
Performance Reproduction
Both sides run the same model and the same SGLang benchmark workload: prefill (out 1, mc 128) · decode (out 1024, mc 128) · decode (out 1024, mc 512).
TPU: SGLang-JAX (Fused MoE V1 / V2). TPU v7x, 16 chips (2×2×4 ICI torus → 32 devices), tp = ep = 32, dp = 8, per-channel fp8 MoE weights.
The TPU run uses sgl-jax branch fused-moe-v2-with-sp-rs @ 49c2ed1 and image jax-ai-image/tpu:jax0.8.1.
The V1/V2 ablation changes only the MoE flags: Fused v1 = --moe-backend fused; v2 base = fused_v2 --no-moe-fused-act-quant --no-moe-fused-shared-experts.
The v2 +act-quant case adds --moe-fused-act-quant; v2 +act +SE-overlap turns both on. The two external-shared-expert configs use --mem-fraction-static 0.85 because they OOM at 0.88.
GPU: SGLang (H200×16, reference). 2 nodes × 8× H200, tp = 8, pp = 2; same model and benchmark workload as the TPU runs.
Full benchmark commands for the performance runs are in the SGLang-JAX cookbook.
Server Launch and Accuracy Reproduction
The AIME 2026 check uses MathArena/aime_2026, 30 problems, pass@1: 26 / 30 = 86.7%. The run has zero request errors and all responses terminate normally (finish_reason=stop, no truncation at 32768 tokens). This suggests no obvious accuracy regression from the fp8 fused-MoE serving path.
Full launch-server commands, request and tool-calling examples, and the AIME 2026 accuracy reproduction are in the same SGLang-JAX cookbook.
References
[2] Hybrid models meet SGLang (blog)
[4] Fused MoE V1 kernel, tpu-inference
[5] Fused MoE V1 kernel adapted in SGLang-JAX
[7] Gated Linear Attention (GLA)
[8] MiniMax-01 (Lightning Attention)
Acknowledgments
AntGroup-ASystem Core Team: Zhenxuan Pan, Guowei Wang, Yuhong Guo, Shuo Wan
SGLang-JAX team: jimoosciuc, Prayer, aolemila, neo, leos, pathfinder-pf, Haolin Fu, Qinghan Chen, JamesBrianD, Haoguang Cai, Yuhao Hu, cjx0709, Zhengke Zhou, Yuxin Wei, Lianfang Wang, 0xaskr